By logging in, you agree to our terms of service and privacy policy
Start Creating
Data For AI


Want to talk to our sales team instead?
By logging in, you agree to our terms of service and privacy policy
RESEARCH: COST, QUALITY & HEALTH – THE 3 TRILLION DOLLAR DILEMMA

 Kristen
![]() Nov 3, 2016
Nov 3, 2016
DOES HIGHER COST TRANSLATE TO BETTER CARE?
It’s no secret that the US is plagued (pun intended) by artificially high healthcare costs. Yet, despite spending 50-200% more on healthcare than any other developed country, the 2015 World Factbook ranked the US at 43rd in life expectancy. This is partially because of the fact that our 3 trillion-dollar healthcare industry is often driven by supply, as compared to traditional industries that are driven by both supply and demand. This causes treatment costs to be unpredictable and highly variable.
What remains a mystery, however, is the method behind the pricing of medical procedures and whether the costs within this system directly translate to quality of care. Are we really paying for what we’re getting?
THE FACTS OF THE CASE – UNDERSTANDING THE DATA
To better understand this disparity, we gathered inpatient and outpatient data from over 3,200 hospitals throughout the US. This dataset was then enriched with patient surveys, readmission rates, and mortality data from Center for Medicare and Medicaid Services (CMS) Hospital Compare Database. With over 800,000 records, we sought to determine the relationship between the cost of services and quality based on patient reported outcomes.
First, we had to determine how to quantify “quality”- a paradox for anyone who works with data. How can we objectively define one hospital as “better” than another?
As part of the Affordable Care Act, the government has chosen to penalize hospitals with an above average 30-day readmission rate. This suggests that readmission rates may be tied to the quality of care given to patients. If a patient receives inadequate care the first time they are seen and must return for additional care within 30 days, then the hospital should take responsibility. Despite this legislation, many leaders in the medical field have spoken up, arguing against using readmission as a quality measure. They believe that the reasons for readmission are too variable and, more often than not, could not have been prevented by the hospital or physicians. However, counter arguments supporting this metric’s use feel that hospitals can impact readmission rates by better understanding the patients overall risk and improving the coordination of care when patients leave the hospital and start receiving care at home or in post-acute facilities. For this study, we chose to include readmission rates as well as mortality rates as indicators of hospital quality.
In attempting to measure quality, it’s also important to account for the patient’s experience. While more difficult to measure, we believe that the patient’s interactions with the hospital should be strongly considered in determining the quality of care delivery. Bedside manner, clear and timely communication, and perceived treatment of symptoms and conditions are important components of the care a patient receives.
Given the above constraints, the quality of hospital care for this study was determined using the following measures:
- Patient Survey Scores – The Hospital Consumer Assessment of Healthcare Providers and Systems (HCAHPS) is a hospital-administered survey that provides a standardized method of comparing patient perspectives on care in hospitals across the country. Patients rate items in nine areas of care:
- Doctor Communication
- Nurse Communication
- Timeliness
- Pain Control
- Communication About Medicine
- Discharge Information
- Cleanliness
- Quietness
- Care Transition
- Readmission Rates – Readmission rates were derived from CMS’s Hospital Compare Database. These rates are recorded over a 3 year period.
- Mortality – for this study, heart failure mortality was used as a key indicator since this was the most frequent cause of inpatient mortality.
To standardize the data and remove bias, we needed to account for the possibility of data inaccuracy. Therefore, we computed the z-score for each charge and payment relative to other charges and payments within a particular diagnosis group and year. We also calculated the z-score for the patient survey quality scores and readmission rates to prevent biased in the survey scores and readmission rates that were entered into the dataset. This allowed comparison all of the hospitals based on cost, survey score, and readmission rate. Taking into account the data and z-scores, we categorized each hospital as “high cost” or “low cost”, “high quality” or “low quality”, and “high morality” or “low morality”. We were then able to analyze the trends and patterns across these three categories.
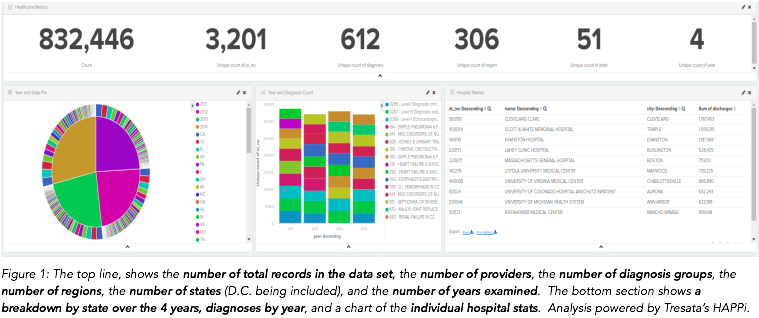
After collecting and cleaning the datasets, resolving all entities (individual hospitals and patients) across all records, and enriching the data with patient surveys and readmission/mortality rates, we leveraged Tresata’s powerful intelligence discovery engine to visualize the data. Specifically, Tresata’s Healthcare Analytics Platform (HAPPi) was used to build a dashboard that could uncover the complex relationships between cost and quality of care. The following figure is an overview showing a summary of over 800,000 records that were analyzed.
THE FINDINGS OF THE CASE – UNCOVERING THE (HIDDEN) INTELLIGENCE
After thoroughly investigating the analyzed results, we can summarize our findings with the following points:
- High Cost IS NOT ASSOCIATED with High Patient Satisfaction –Hospitals with higher costs do not have higher than normal patient satisfaction, and there is no tradeoff between the cost and outcome based on treatment type. Thus, regardless of the amount that a given hospital charges, you are just as likely to have a positive outcome at a low cost hospital than you are at a high cost hospital. Furthermore, the portion of the cost that is covered (by Medicare or private insurers) is also not an indicator of patient satisfaction or readmission rates.
- Survey Score IS INDICATIVE of Readmission Rates – Patient survey responses had the clearest relationship with readmission rates. We found that hospitals with higher patient satisfaction typically had much lower readmission rates. We did notice a slightly lower readmission rate in hospitals that performed a large portion of a region’s procedures. However, overall there was very little variation in readmission rates across all hospitals.

- Competition DOES NOT affect Cost of Care – Competition did not appear to affect the cost of care. We did find that the most competition between hospitals occurred within regions that had on average higher or lower quality hospitals. This can be seen in the visualization below, where the heat map on the right demonstrates that the hospitals with the highest quality scores tend to have the most competition.

- Location IS NOT ASSOCIATED with higher Quality – Location does not conclusively determine a hospital’s quality. We found two hospitals with very different quality metrics that were only 20 minutes apart. One of the hospitals was a very expensive, low quality care center, while the other was an inexpensive, but very high quality care center. The following figure shows this example within the context of joint replacements. We can clearly see that the high cost, low quality hospital charged much more than the low cost, high quality hospital for the same procedure, despite being located within 20 minutes of each other.

If anything can be learned from our research on the disparity between cost and quality of care within the healthcare industry, it’s that there is still a lot of work to be done. When a high cost, low quality hospital can exist within the same market and within the same region as another low cost, high quality hospital, the healthcare markets are clearly broken. They are simply not able to operate efficiently and self-correct like a traditional “free market” that is driven by consumer understanding of quality as well as supply and demand.
All of the data we included in our research was free and publicly available. Before now, however, it’s been challenging to gain any insight into the complex world of healthcare without the tools to process the large amount of data and analyze it at scale. By utilizing Tresata’s HAPPi platform to collect, curate, resolve, enrich, and visualize the data, we were able to quickly discover the underlying trends and relationships within this massive dataset.
To summarize, we found that the data confirmed many of our initial suspicions – namely, that cost had little or no bearing on the quality of care received.
Moving forward, we plan to continue our research to include census data to see how the cost of living impacts cost of treatment. We also hope to incorporate additional years of data to determine the impact of changes in care over time and look at whether the intensity and duration of the various conditions have any significance. And as always, our stated goal with Tresata Health is to share all our research and findings with the industry, and we will continue to do so.