By logging in, you agree to our terms of service and privacy policy
Start Creating
Data For AI


Want to talk to our sales team instead?
By logging in, you agree to our terms of service and privacy policy
COAT 3.0 CASE STUDY – COUNTY LEVEL ANALYSIS

 Chris Cardwell
![]() May 27, 2020
May 27, 2020
Driving to the grocery store, I see others around me in their own cars, enjoying the ride with their families – a small bit of freedom after sheltering in place for the past several months. I watch them soaking in the sunlight, absorbing all the scenic beauty they can from inside the confines of their vehicles, and breathing in the fresh air (conditioning). In the store parking lot, they begin the new routine so many of us are incorporating into our lives – affixing the facemask, gloves, hand sanitizer, etc. – to complete the new “pandemic grocery store chic” ensemble (all joking aside, a big thanks to those of you who are doing this to protect our vulnerable populations).
Protecting the nation is now in the hands of every individual and we’ve all slowly amassed an arsenal of face coverings, latex, and disinfectants. As social beings, we look forward to time with friends and family beyond just on a screen…but as we define a ‘new normal’, there are adaptations we will need to make in order to thrive in a post-pandemic world. And while it is ultimately up to individuals to comply, the US government has provided basic guidelines for state, local, and regional governments to navigate this new terrain – outlining the ‘3P’s’ – phases, precautions, and protections.
To properly enact these 3P’s, we need to be aware of the daily case counts, identify where the hotspots are, and recognize how things are changing with respect to time. We also need to gauge if we have the right amount of resources to respond to the changing circumstances. With the latest version of Tresata COAT, we’ve added in a new metric (Rt) to enhance our ability to recognize, synthesize, and predict these factors.
Rt is utilized by epidemiologists to understand and predict the spread of a deadly virus accurately in order to communicate to the public what measures need to be taken in order to mitigate risk. While epidemiologists use Rt more often than we do in our daily lives (excluding those of you who have become self-proclaimed COVID 19 experts), it can easily be understood. Put simply, if Rt is greater than 1 then for every person who is infected, they will spread it to more than 1 person on average. Hence, the closer Rt trends towards 0, the safer it is to loosen restrictions in that region.
Although all of this information is publicly available on the internet, there aren’t many sources that talk about county level Rt analysis over time…AND, although many a dashboard exists to illustrate the spread of infection for larger regions, none are looking at a county level (and certainly not in an automated way).
Why is the county level Rt important when we know the condition of a particular state in its entirety? As we’ve mentioned before, COVID19 has no boundaries. So, while certain counties and regions may have had more stringent social measures in place, surrounding counties without them can still put those areas at risk of becoming a hotspot. This is where C.O.A.T provides a more granular view of county level Rt to understand if a county is ready to reopen. C.O.A.T presents the daily case count, testing trends, medical resources available and calculates the probable estimate of Rt at the county level – informing data-centric decisions that let us move forward in phases, with the appropriate precautions and protection.
To understand C.O.A.T on a more granular level, we’ve provided a few sample counties below that have shown interesting case count and Rt analysis patterns over the past week.
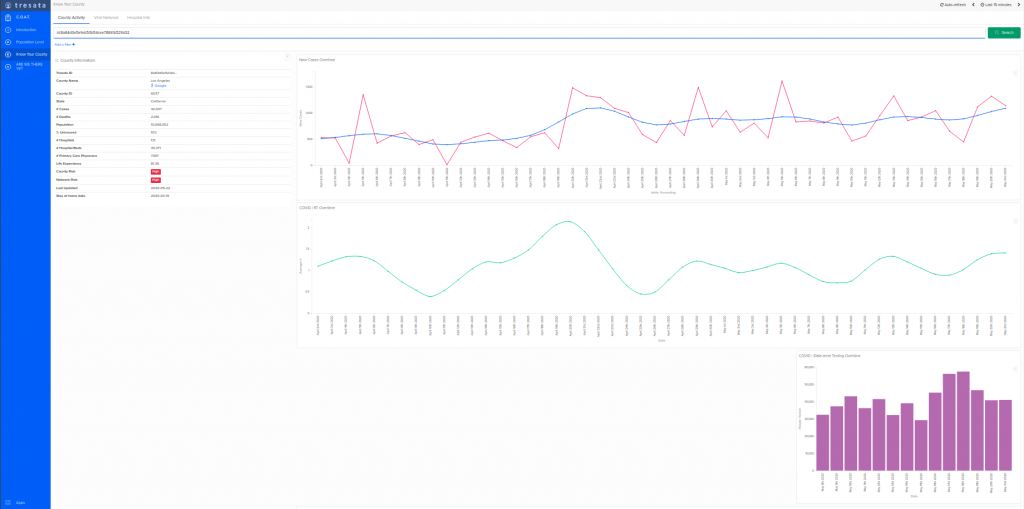
LOS ANGELES, CALIFORNIA (LOS ANGELES COUNTY)
New case counts have been steadily increasing on average overtime. The Rt value for LA county has remained steady (slightly above 1.0), which is consistent with a steady increase in new cases over the past few weeks. Day by day increases in new case counts do not trend directly with state-wide testing efforts, but seem to lag by a few days.
Los Angeles county continues to monitor progress before allowing for additional reopening in-line with the rest of the state of California. LA County is one of 11 counties in California that have not yet moved to phase 1. Considering that the Rt value remains elevated above 1.0, the county may be waiting for a slowdown in new cases before moving forward with phase 1.
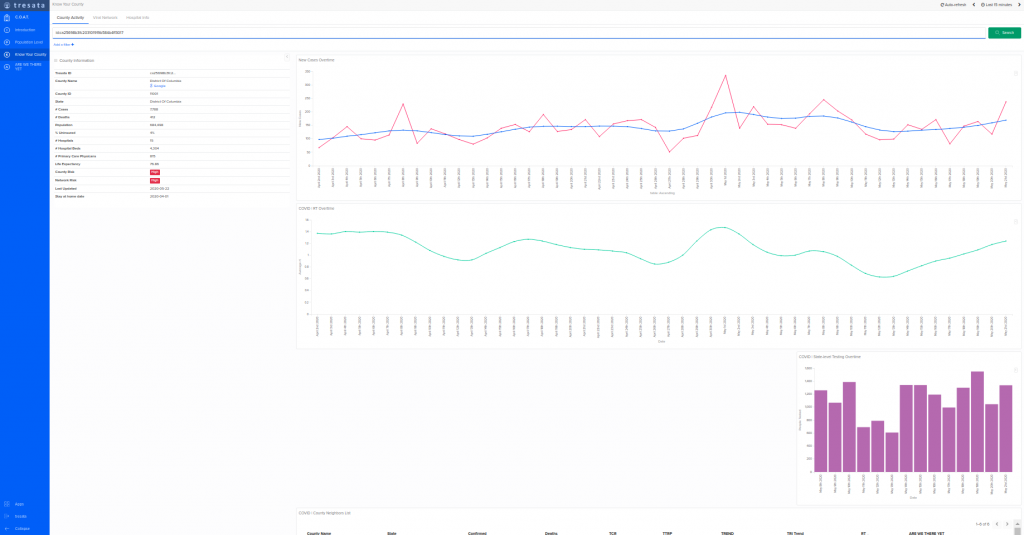
WASHINGTON, DC (DISTRICT OF COLUMBIA)
Washington DC displays some slight increasing trends in new cases over the past week. The Rt value has been rising accordingly. There has been an uptick in testing in the past week that likely explains the increase in new case counts more recently.
Washington DC remains cautious before moving to Phase 1 of reopening. Neighboring suburbs of DC, such as Arlington, plan to move to Phase 1 by the end of May. The next decision for DC will be made on Wednesday, May 27th regarding if the District will move to Phase 1 on Friday, May 29th. Given that the increase in new cases corresponds with increase in new cases, the spike in new cases is likely due to increased testing.
NEW YORK CITY, NEW YORK
New York City has seen a steady decline in the number of daily new cases over the past few weeks. This is reflected by a respective Rt value that has been below 1.0 over that time period. The more recent fluctuations in new case counts and Rt value trend with state-level testing efforts as well. This trend suggests that the more recent spikes in new cases are likely driven by increased testing efforts.
New York City remains closed while neighboring regions like Long Island begin the phase 1 recovery. Gov. Cuomo has suggested that continued testing and monitoring at the zip code level will drive next steps of the reopening decision.

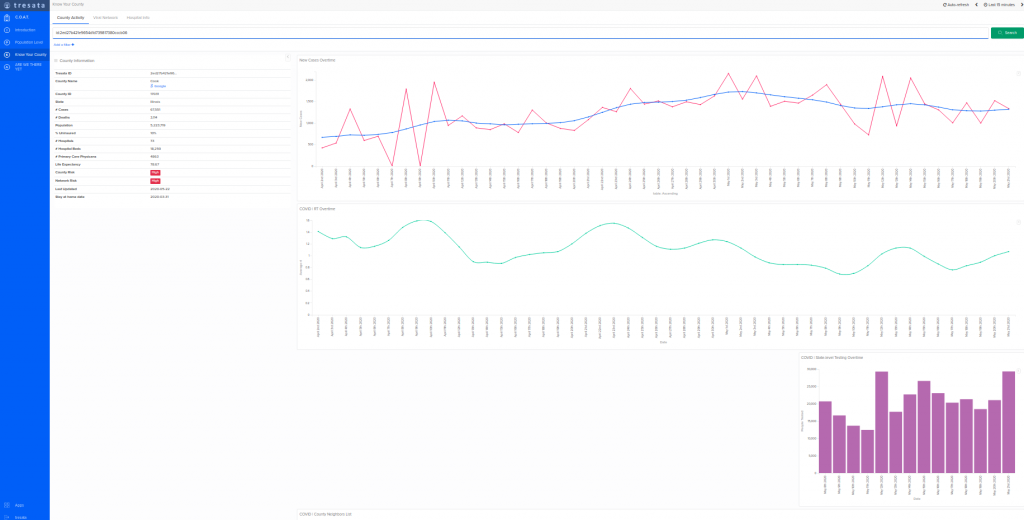
CHICAGO, ILLINOIS (COOK COUNTY)
Cook County has seen a steady trend in new case counts over the last week. This is reflected by an Rt value around 1. Testing levels in the state of Illinois have also remained steady between 20,000- 25,000 tests per day.
The state of Illinois is set to begin their reopening (phase 3 cautious reopening) on Friday, May 29th, however Chicago plans to keep stay at home orders in place (phase 2) for at least until mid June.
CONCLUSION
Across each of these four major regions (NYC, Los Angeles, Chicago and Washington DC), there are not significant downward trends in new case counts that easily justify reopening. While none of these locations have yet opened up, these stances are consistent with the data that suggest there may not be a positive enough trend in new case counts and Rt metrics to begin the reopening process.
What’s important to note is that each of these cities have departed from state-level guidance and taken a more cautious approach to focus on their individual situations. The Rt value of each of these counties will be ever more important to monitor over the next few days and weeks as state-level models do not provide the granular details needed to guide city and county leaders.