By logging in, you agree to our terms of service and privacy policy
Start Creating
Data For AI


Want to talk to our sales team instead?
By logging in, you agree to our terms of service and privacy policy
TRESATA COAT 2.0 – INTRODUCING
TRESATA RECOVERY INDEX (TRI)

 Brittany Box
![]() Apr 23, 2020
Apr 23, 2020
When we launched the COAT app just a couple weeks ago, we focused our efforts on predicting emerging hotspots on a county by county basis across the US. Our initial aim was to provide first responders, healthcare organizations, non-profits, and government agencies with a signal amidst the noise and speedy access to the intelligence needed to make decisions related to resources, testing, and preparedness measures. While we aren’t doctors, politicians, or epidemiologists, we created a “tool” (software) that could be utilized to augment intelligence for these groups in a time when they need it most. We’ve since been sharing daily predictions for the highest risk emerging areas.
In these past two weeks, the conversation focus has shifted away from where the virus is heading (i.e where are the ‘hot spots’) to “recovery” (i.e. where are the potential ‘cold spots’)…and how we ultimately can start to rebuild a “new normal” outside of our own homes. Many countries and states have introduced lockdown measures and/or social restrictions in an attempt to flatten the curve – but it’s certainly too early to declare victory. And unfortunately, identifying ‘COVID opportunity zones’ – what we are calling ‘cold spots’, or areas where opening up could be possible – is more complicated than identifying where to build a firewall to prevent further spread (i.e. the focus of COAT 1.0).
There is an abundance of risk that comes with reopening a city and, although there are many theories on how to mitigate at least some of these risks, there are differing goals. From a public health’ perspective, it should be done in areas that are not at risk of a resurgence and it should protect vulnerable populations. From an economic perspective, and as we’ve reached historic levels of unemployment, the urgency to reopen becomes much greater. Last night, the US announced that this reopening will be done in phases, and can be done state-wide or county-by-county at the government’s discretion.
Keeping this discussion in mind, we have added a new indicator within the COAT application that uses the same core data set (or Data Asset, as we call it) and underlying ‘AI’tomation capabilities to derive intelligence around recovery at the county level. This new indicator is the Tresata Recovery Index, or TRI.
ABOUT TRI
TRI is a velocity metric that determines at what rate the virus is slowing in each US county. This indicator can be used to identify which counties are closest to “recovery”, based not only on a county’s risk score, but also an overall network understanding of surrounding counties’ risk and recovery scores.
HOW WE DID IT
TRI uses the TCR and TREND scores, and enriches them with state lockdown data to determine the velocity of cases/per capita in each US county. This velocity metric score is propagated throughout the network algorithm to determine which areas we can expect to see a slowdown in the number of new cases. The TRI Trend score categorizes the trending velocity into INCREASING, DECREASING, or STABLE.
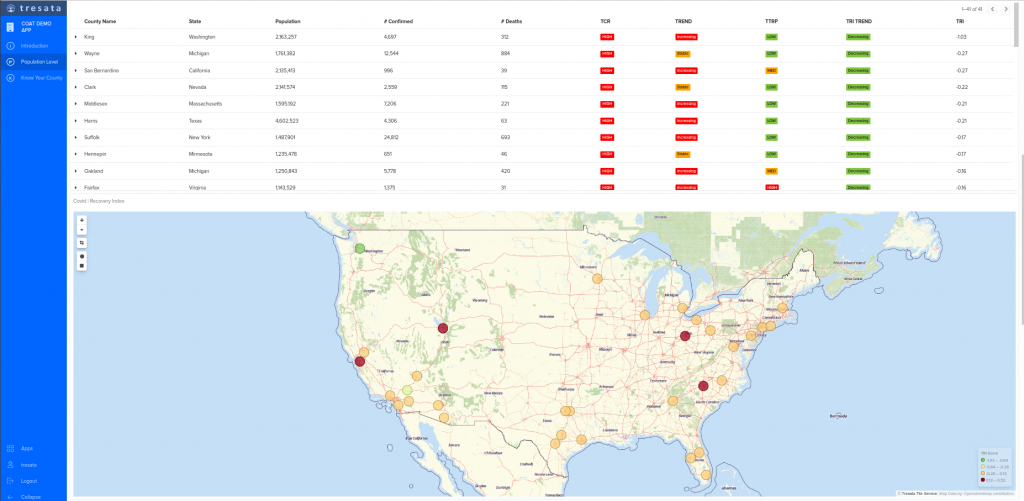
For example, in King County, Washington, we see a decreasing TRI Trend score indicating the velocity of confirmed cases is decreasing. When considering neighboring counties to King, the TRI score is also negative, indicating the surrounding counties may also be experiencing a slower velocity of confirmed cases.
WHAT WE THINK TRI CAN BE USED FOR
Unlike the other risk dimensions already in COAT, TRI is used to identify “cold spots” where the virus is showing slowing characteristics. This can be used as a leading indicator to where we can potentially restart economies and societies, county by county.
In our first release of this score, the following counties were our TOP 10 TRI COUNTIES (of counties with >1MM in population):
- King, Washington
- Wayne, Michigan
- San Bernandino, California
- Clark, Nevada
- Middlesex, Massachusetts
- Harris, Texas
- Suffolk, New York
- Hennepin, Minnesota
- Oakland, Michigan
- Fairfax, Virginia
WHAT WE PLAN TO DO
COAT is an evolving application, meaning we are constantly improving the tool to provide more capabilities for the user. This includes enriching the data asset with additional sources, adding more dimensions to the county profiles to produce more refined risk scores. These additional data sources include more information about nursing home locations, social health determinants, and other key demographic information that has been found to impact the infection rate.
In accordance with the ‘Opening Up America Again’ (OUAA) plan released by the White House last evening, US governors will utilize specific gating criteria to reopen the country up slowly. The indicators listed in the State or Regional Gating Criteria – symptoms, cases, and hospitals – are already quantified in the Tresata Recovery Index, making it a perfect barometer for predicting which counties are able to reopen.
We plan to release a new feature of the application that recommends an Are We There Yet? classification for each region based on the criteria for each of the phases to reopen the country, and the TRI. This will be updated daily to reflect the number of counties that are ready to be promoted to the next Phase based on guidelines shared in the OUAA plan.
CONCLUSION
Our goal with both TRI and the Are We There Yet? score is to provide insight for decision makers as they determine the best path forward. They, like many of us, are plagued by the uncertainty of WHEN and HOW we will be able to return to normal, and there are no clear answers in sight just yet. With COAT 2.0, we aim to provide an added dimension to inform these resolutions.
COAT 2.0 UPDATE – INTRODUCING THE ‘ARE WE THERE YET’ FEATURE
Imagine you’re 5 years old again. You’re sitting in the back of your parents car, on a road trip that never seems to end. You’re antsy, hungry, and battling your sister for more space in the back seat; more than anything you just want to get out of the car.
“Are we there yet?”
COVID-19 has been the throwback none of us asked for – you’re 5 years old again, feeling trapped, out of control, and perhaps even still arguing with your sister or roommate over shared space.
And as lighthearted as this analogy may be, there’s unfortunately no GPS system telling us exactly how far we are in this situation. There are no maps – only thousands of suggested routes, each with varying hazards and ETAs.
Last week, the US passed on the responsibility to state governors to determine how fast each state or county can get “there” – the “there” being in a position to explore loosening social restrictions and reopening commerce. In these newest OUAA guidelines, states and counties have the ability to lift their lockdown measures provided they meet the Proposed State or Regional Gating Criteria.
Put more simply, states or counties can reopen if they meet 3 criteria:
- SYMPTOMS – region has a downward trend in reports of influenza-like or coronavirus symptoms over a 14-day period
- CASES – region has a downward trend in new, confirmed coronavirus cases over a 14-day period
- HOSPITALS – region has a hospital system that can adequately test healthcare workers and treat patients in critical condition
After 14-days of decreasing symptoms and cases, and sufficient hospital resources, a state or country can open to “Phase One”, which allows restaurants – and other sites of larger gatherings – to reopen with strict social distancing guidelines in place.
Easy enough, right?
In theory, this is very easy to determine. However, given the tremendous risk to human life (remembering always that these “numbers” we are seeing are not merely data points, but actual humans) that comes with reopening a state that is not ready, it is critical to understand and monitor changes across each of these gating criteria.
[UPDATE] COAT 2.0’s NEWEST FEATURE
At the end of last week, we announced Tresata TRI – the Tresata Recovery Index. This velocity measure determines the rate of change in the number of confirmed cases at the county level.
When we introduced TRI, we were seeking to add in a measure of how close to “recovery” each county is (aka identify “cold spots”). However, TRI lends itself quite easily towards the new OUAA guidelines. Tresata’s Are We There Yet (AWTY) feature uses the Tresata Recovery Index to identify counties that meet the 14-day decrease in new confirmed case count criteria.
AWTY identifies all counties that meet the case criteria on a daily basis, and categorizes each county into the following buckets: THERE, ALMOST THERE, or NOT THERE YET, as shown below.
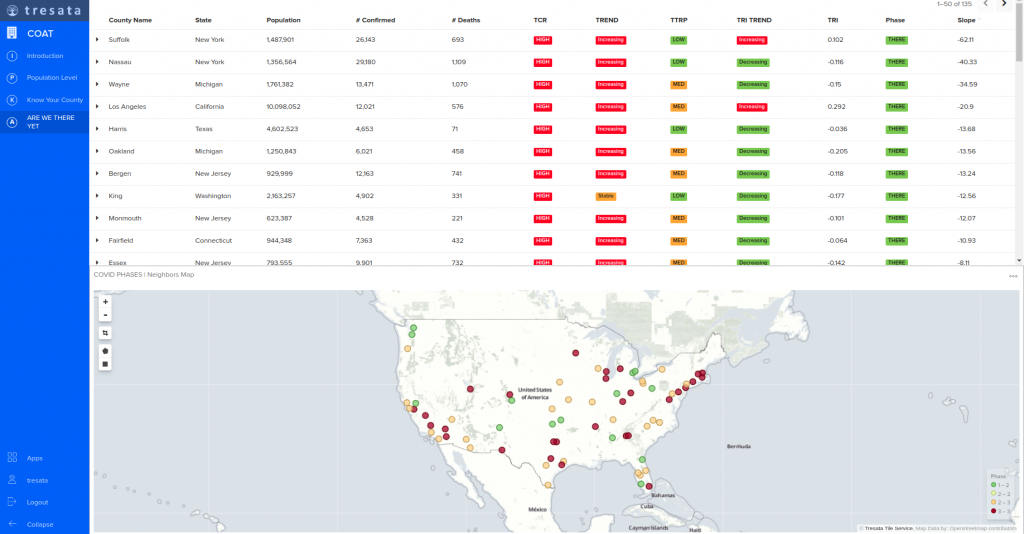
As you can see, there are already several counties that have passed the cases threshold to reopen, in accordance with the second OUAA guideline detailed above. However, this map also depicts the close proximity some of these counties have to other counties that are not ready to reopen.
As of April 19, the following 10 counties (population > 500K) have had a decline in new case counts in a 14-day period, or in our terms, they’re “THERE”:
- Suffolk, NY
- Nassau, NY
- Wayne, MI
- Los Angeles, CA
- Harris, TX
- Oakland, MI
- Bergen, NJ
- King, Washington
- Monmouth, NJ
- Fairfield, CT
KNOW YOUR COUNTY
While AWTY identifies counties that are ready to reopen, COAT’s Know Your County feature makes it easy to quickly view the county profile and network. This gives the full story (versus one small piece) – which is that while one county may have a steady decline in the number of confirmed cases, neighboring counties and states may not.
WE’LL ALL GET THERE – WHEN THE WORLD IS READY
We are all eager for the country, and the world, to reopen – to see our friends and family in person, to enjoy the beauty this world has to offer, to celebrate the joys of life in ways that don’t involve a screen – but we need to do it safely and in a way that protects us all as best we can.
We want to be clear that as powerful as this tool may be in terms of providing intelligence, it is also not a crystal ball. Our new measures consider the rate of change of confirmed cases, but this is not the only indicator that a state is ready. AWTY makes it easy to track how much of the country is THERE or ALMOST THERE based on confirmed cases (and public data).
Coming back to our road trip analogy -it is a means of helping to draw the “maps” and develop a better sense of ETA.