By logging in, you agree to our terms of service and privacy policy
Start Creating
Data For AI


Want to talk to our sales team instead?
By logging in, you agree to our terms of service and privacy policy
INTRODUCING COAT 3.0

 Kristen Koehler
![]() May 19, 2020
May 19, 2020
This past weekend, I donned my mask and walked to the closest cafe to get a coffee and a cookie (life is short, people) for breakfast. Like most cafes in London, this one has adapted the way they serve their customers to accommodate social distancing measures, and is now serving through the store’s front window.
It’s a charming experience – the storefront now displays all of its pastries and treats front and center – tempting hungry passersby out on their daily walk.
As delightful as this new experience may be, it’s hard not to miss sitting in the cafe, catching up with a friend, and people-watching over a cup of coffee. The sad reality is that, with coronavirus still taking the wheel, we are not ready to open up cafes to allow for this old pastime…and when they do open, the experience may be completely different altogether.
COVID-19 is a highly contagious disease – and even with proper distancing measures in place, it has a reproduction rate of almost 1 in many large cities. This means that for every 1 person sitting in the cafe with you, it is likely to spread to 1 more person, which can have a ripple effect as that person goes on to meet another friend at another cafe, and so on.
Many leaders throughout the World have announced roadmaps for opening up countries, states, and regions. Several, including the UK where I have been weathering the storm, are based on a single measure – the R value – a key metric centered on how fast the virus is growing. Basically, the R value is a measurement of an infectious disease’s reproductive potential, i.e. the average number of people that one infected person could potentially pass the virus onto.
With COAT 2.0, we adapted our focus to identifying cold spots (aka potential sites for recovery) versus that of the first version on emerging hot spots (aka areas prone to infection) on a county by county basis across the United States. This aligned to the evolving dialogue across the country, as people searched for signals for when they could safely open back up.
As our last case study suggests, the conversation is shifting yet again. Now that the country is slowly reopening, the nation has an eagle eye on the infection rate, hoping conditions don’t worsen (and lead to previous restrictions being reinstated).
Accordingly, COAT 3.0 incorporates the ‘Rt value’ as another metric to aid in determining whether or not a county is ready to open (or if it needs to return to stricter measures to counter the spread), based on the most current data. The Rt value will update daily, as the conditions change in each county in the US.
Rt DEFINED – ‘REAL-TIME’ INFECTION POTENTIAL
As we’ve learned, Epidemiologists use the R0 (pronounced “R-naught”) value to understand the number of secondary infections that spawn as the result of one single infection. If R0 is greater than 1, then for every 1 person who is infected, they will spread it to more than 1 person on average. If R0 is less than one, the disease will spread but disappear before it affects the whole population.
The Rt value is R0 taken at a particular point in time (in this case, we think of it as “real time infection potential”). It is currently one of the best ways to measure how safely a state or county can open up because it reflects the changing rate of infections that result from social distancing practices.
For our fellow nerds who are interested, we implemented this derivation of the Rt algo on Spark:
https://github.com/k-sys/covid-19/blob/master/Realtime%20R0.ipynb
WHAT’S NEW
So, what exactly is new in COAT 3.0?
NEW METRICS
We have added the Rt value for every county using the algorithm described above. We have also included an Rt Network value. Similar to the TRI metric, we used Tresata’s network algorithm to propagate the Rt value across the network of counties to understand how counties’ Rt values are linked. Both Rt and Rt Network values are updated daily.
NEW DATA
In addition to the new metrics around the rate of infection, we’ve enriched the application with state level testing data. Providing ample testing is one of the requirements for states to be able to re-open. COAT 3.0 now includes this state testing data in each profile to better contextualize its journey towards re-opening.
HOW COAT IS DIFFERENT FROM WHAT’S OUT THERE
With so many dashboards in existence, it’s hard to decipher how they are all different (and how they can be used to get you the answers you are looking for).
There are other dashboards out there that visualize the changing Rt value across a country. As many have accurately pointed out, a single Rt value cannot be used across the whole United States. COAT is the only application illustrating this metric at the COUNTY level – which is significant in that the data has more specificity, can be applied to unique counties (versus the entire state) – particularly for areas exploring regionalized reopenings.
HOW COAT 3.0 CAN BE USED
North Carolina is one of the states exploring a regionalized reopening. Let’s take a look at Mecklenburg County, home of Tresata HQ.
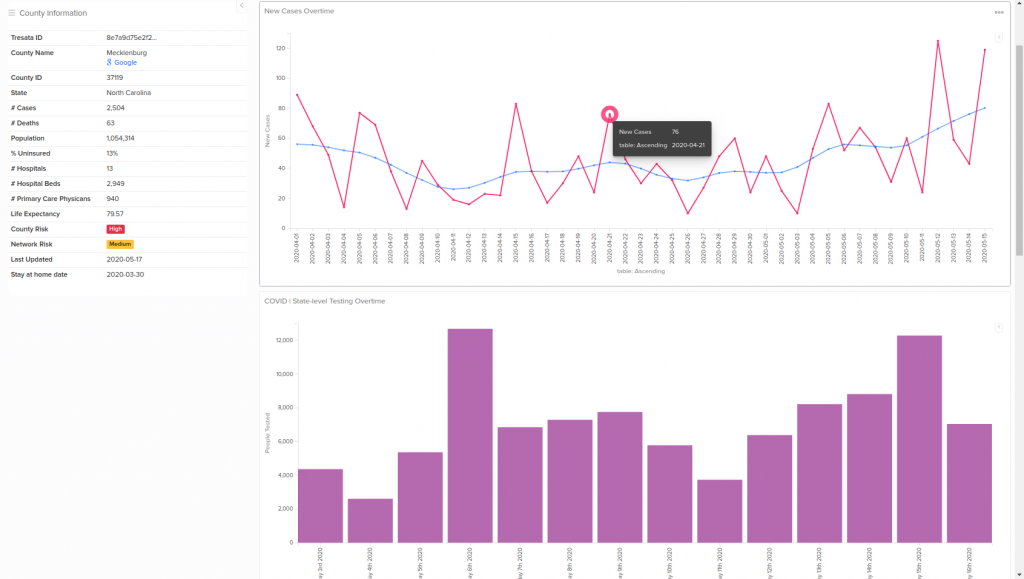
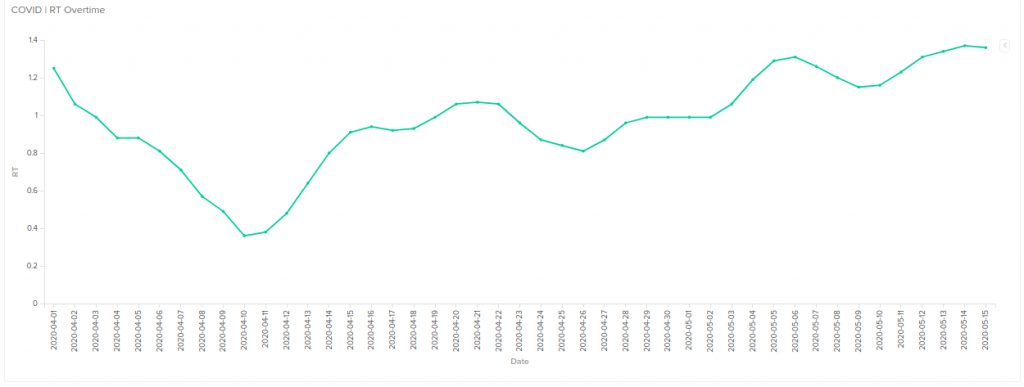
Taking a look at Mecklenburg County’s trend in Rt reveals some concerning results. Since early May, its Rt value has been trending upwards, surpassing 1 now for the last several weeks. The reopening process for Mecklenburg County began in early May. Governor Roy Cooper has announced that he hopes the state can move into phase two beginning May 22.
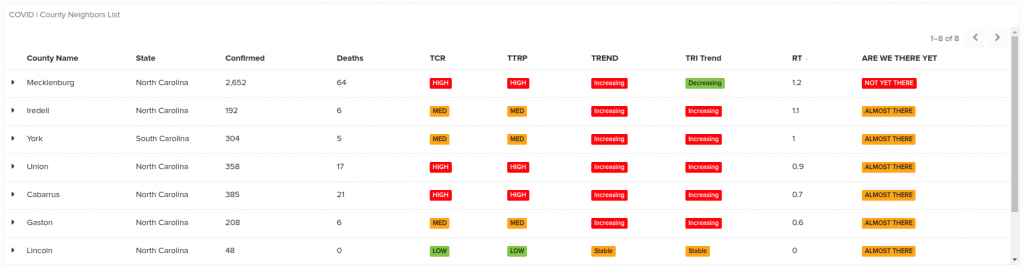
If we zoom out to look at the counties surrounding Mecklenburg, you can easily see how much the Rt value varies, demonstrating the need for a more narrow lens to truly understand the impact potential.
CONCLUSION
As has been the case with both prior versions of the COAT app, our goal in adding the Rt metric is to provide further intelligence for decision makers as they establish the best path forward. With COAT 3.0, we’ve enhanced the ability for users to zoom in and zoom out down to the individual county level.